Breaking Down Texture’s Device Detail Page — Batteries
Earlier this week, our CPO and Co-founder Nicholas Brown published Your Energy Customers Are Your Users Now.
This post highlights the lack of user-centric design in today’s energy technology solutions — and why it’s a problem. At Texture, we recognized this gap in the industry and tackled it head-on.
Texture’s platform delivers a powerful combination of an intuitive user interface and a robust API layer, providing seamless data access and management for energy networks. Today, we’re diving into one specific feature of our dashboard: the Device Detail Page for batteries.
We recently launched an enhanced Device Detail Page, combining improved data visualizations with more granular device details. Let’s explore what’s new, how the data is structured, what it reveals about battery performance, and how it can deliver value for energy companies. All the data points discussed here are also accessible via our API.
#Battery Data Model Structure
The foundation of Texture’s Device Detail Page lies in its consistent and flexible data models, designed to provide deep insights into battery performance and usage. By maintaining uniformity across device types, our platform simplifies the process of building applications that interact with various devices. Each data model includes essential details that fall into three main categories:
- Basic Information: Universally applicable attributes such as the device’s unique ID, manufacturer, model, serial number, and location.
- State Updates: Regularly transmitted information about the device’s current status, enabling real-time monitoring and decision-making.
- Commands: Actions that the Texture platform can send to the device, such as changing operating modes or setting backup reserves.
For batteries, these concepts expand to include highly specific metrics designed to offer granular insights into performance and usage. These systems often work alongside renewable energy sources to store surplus energy and discharge it when needed. They play a critical role in reducing peak demand charges, providing backup power during outages, and optimizing energy strategies.
#Key Battery Data Points
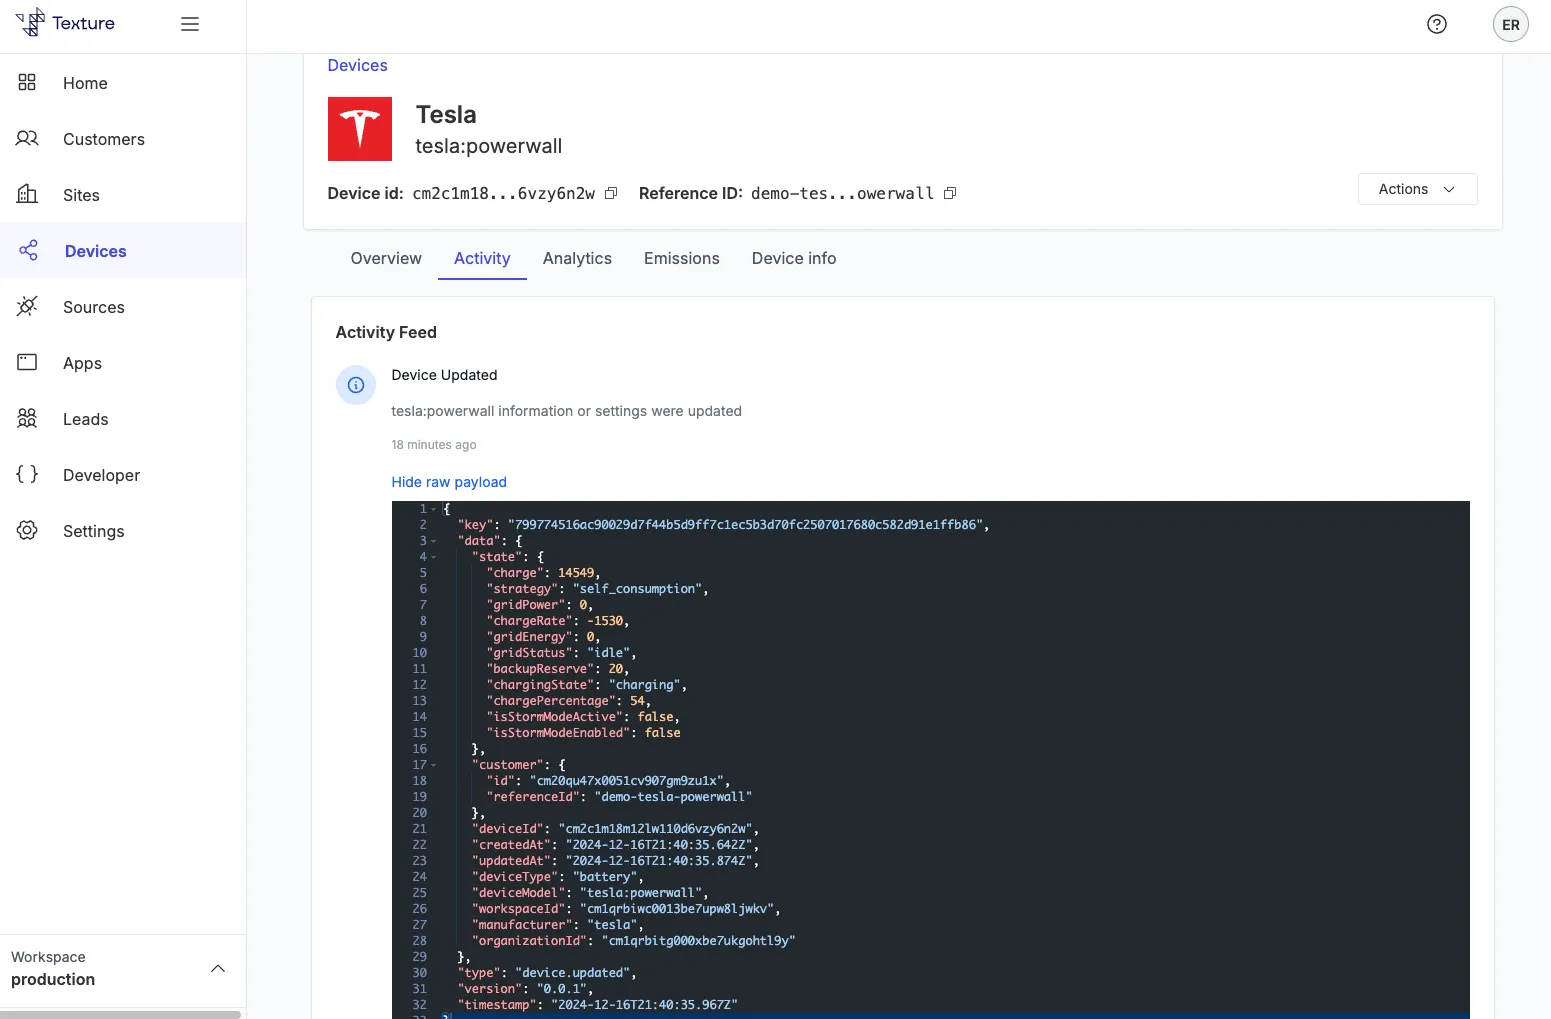
Below is a snapshot of a battery data payload and its essential fields:
- Charge: Displays the current charge level in watt-hours (Wh). (Note: while captured in Wh, we generally display it in kWh or MWh.)
- Charge Rate: Measures the rate of charge or discharge in watts (W). Positive values represent discharge, while negative values indicate charging.
- Backup Reserve: Sets a percentage of the battery’s capacity as reserved for emergencies.
- Grid Status: Captures the interaction between the battery and the grid (e.g., importing, exporting, idle).
- Grid Power & Energy: Tracks the flow of power and energy to and from the grid.
- Strategy: Specifies the battery’s operational mode, such as self-consumption or backup. For example, “self-consumption” prioritizes using stored energy on-site, while “backup” maintains a charge for outages. Learn more about battery strategies in a later post: Battery Storage Strategy 101: Optimizing for Demand-Side Management
- Storm Mode: Includes flags for whether storm mode is enabled or if an active storm alert is currently in effect.
- Wh Consumed: Tracks the total energy consumed by the battery in watt-hours (Wh) since the last state update.

#Visualizing Battery Data on the Platform
Previously, the Device Detail Page functioned as a quick summary. With this update, it now includes grouped sections, enhanced visual charts, and deeper insights to help users better interpret their battery data.
#Overview Section
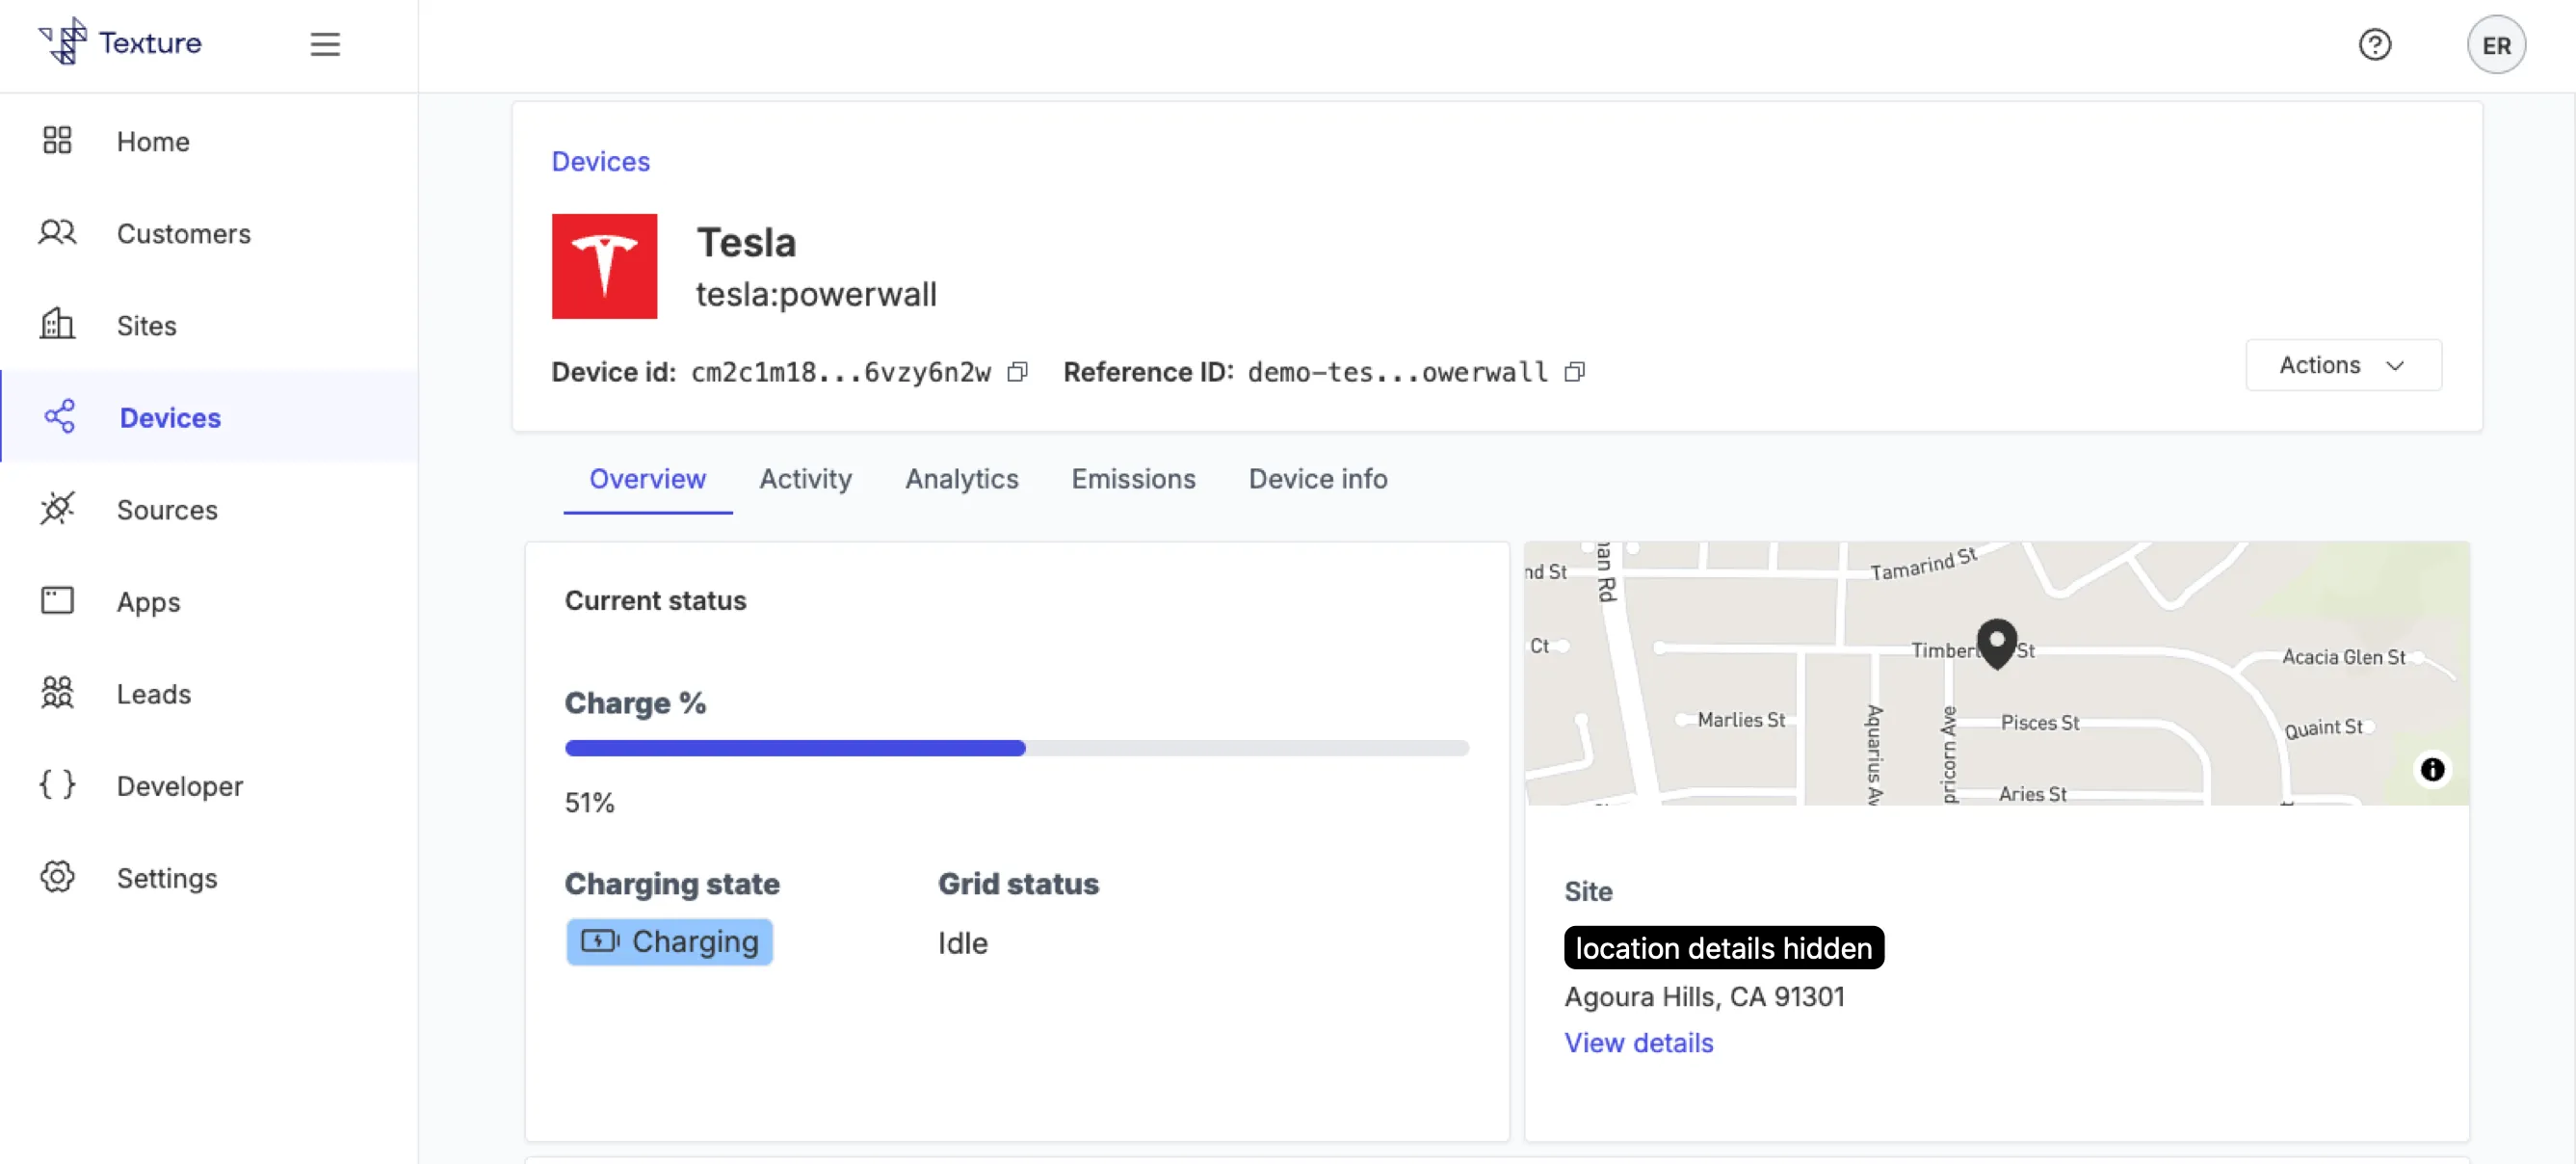
When you open the Device Detail Page, you’ll land on the Overview section, which highlights:
- Device Details: Manufacturer, device type, unique ID, and reference ID.
- ID: A unique identifier assigned by Texture.
- Reference ID: User-assigned identifiers, such as customer IDs or emails.
- Site Information: The physical location of the device, tied to the customer.
- Current Status: Refreshed every 5–15 minutes depending on the OEM, including:
- Charge Percentage: Battery’s state of charge as a percentage.
- Charging State: Whether the battery is charging, discharging, or idle.
- Grid Status: The interaction between the battery and the grid (e.g., importing, exporting, idle). For instance, if it is “importing,” the battery is taking energy from the grid; if it is “exporting,” it is sending excess energy back to the grid.
#Graphs Section
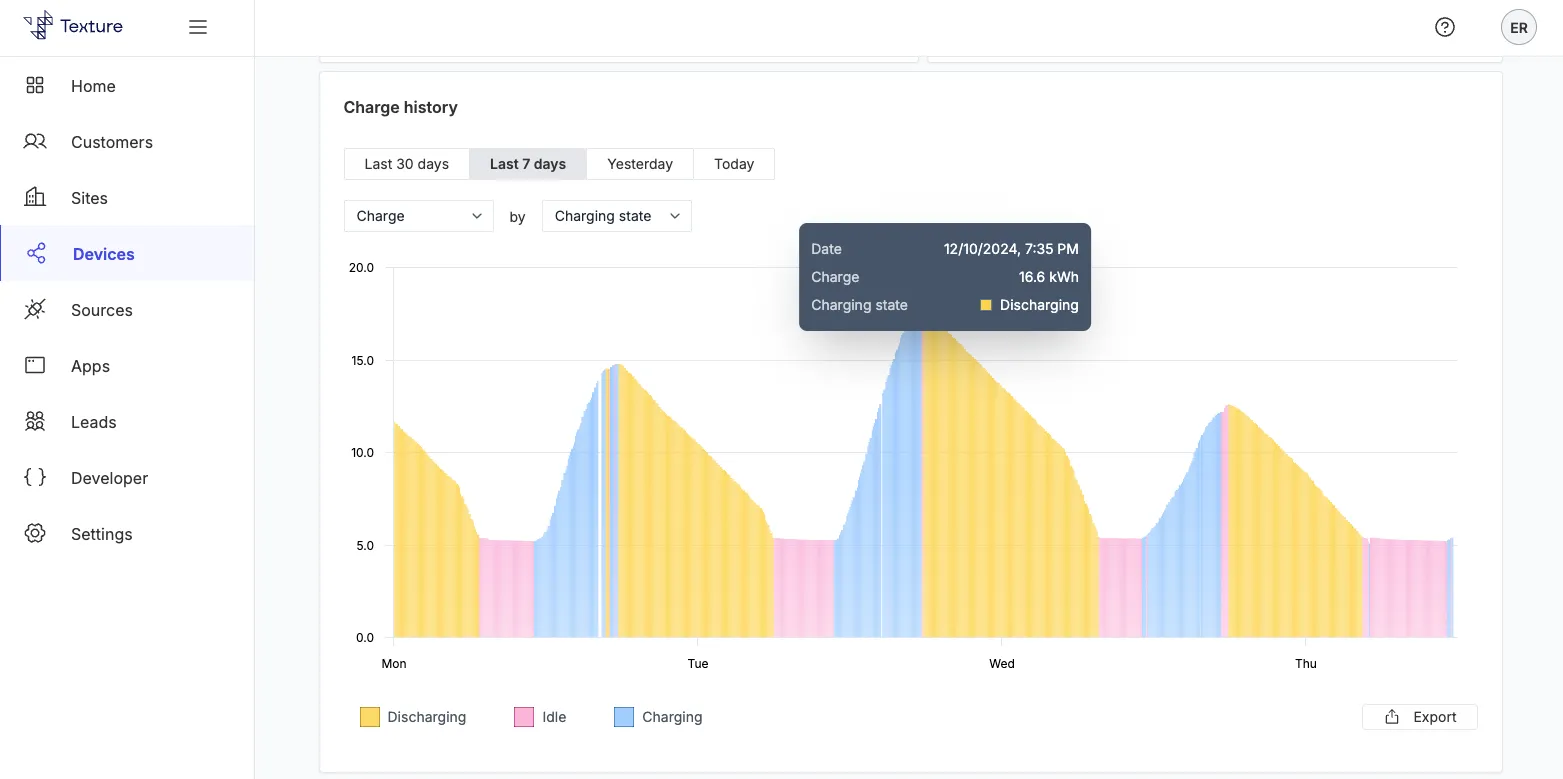
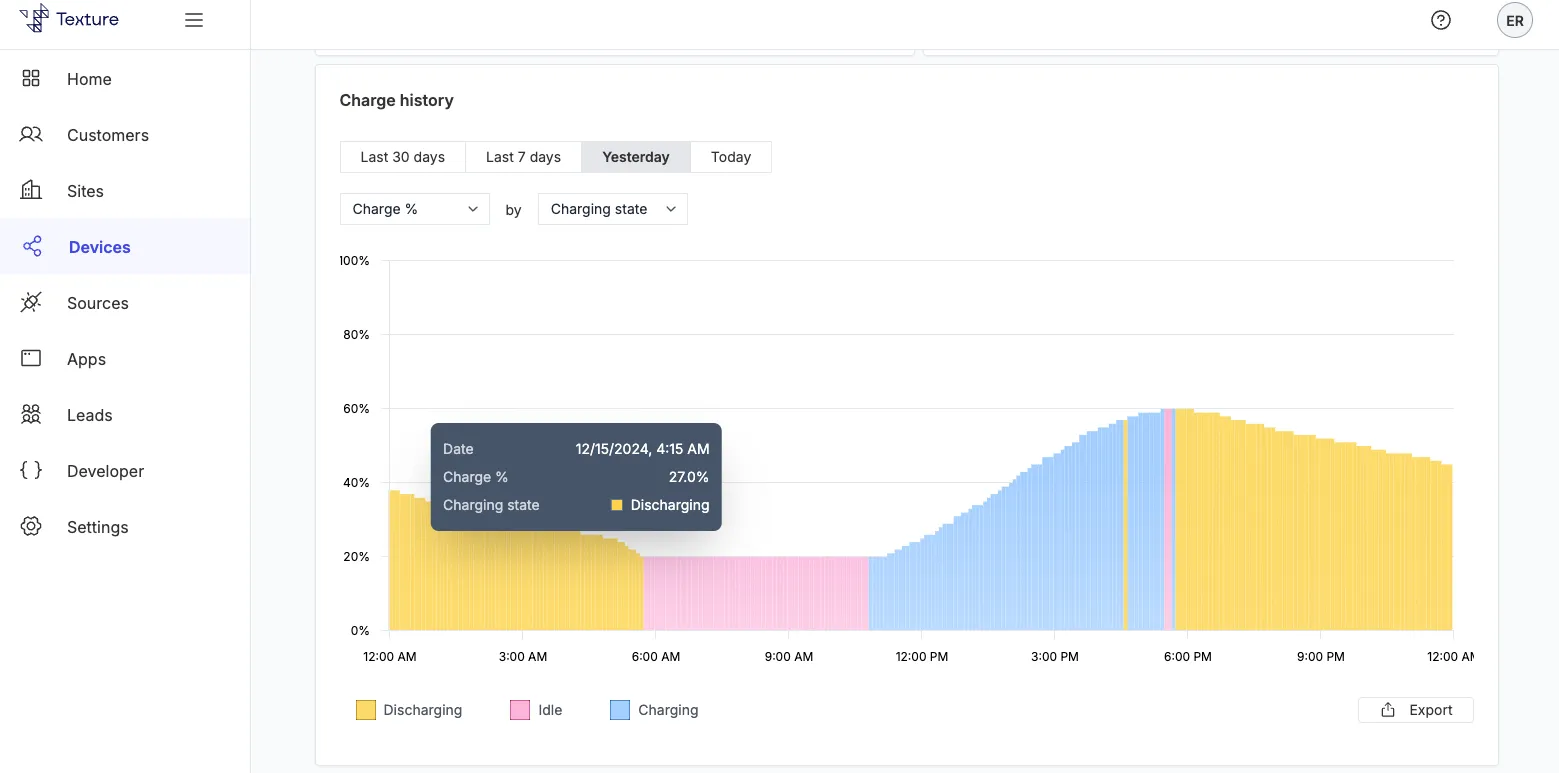
You can toggle between displaying Charging State and Grid Status on the same graph, allowing users to focus on the metrics most relevant to their needs. Each graph includes time toggles (Last 30 days, Last 7 days, Yesterday, Today), and hovering reveals data insights like date, time, kWh, and commands sent.
Our enhanced graphs are color-coded to make data interpretation intuitive:
- Charging State: Discharge (yellow), Idle (pink), Charging (blue).
- Grid Status: Importing (pink), Exporting (green), Idle (gray).
Key graphs include:
- Charge History: Tracks charge and discharge cycles, offering insights into energy usage patterns that can inform load shifting, peak demand reduction, or optimizing backup reserves.
Device Detail 2 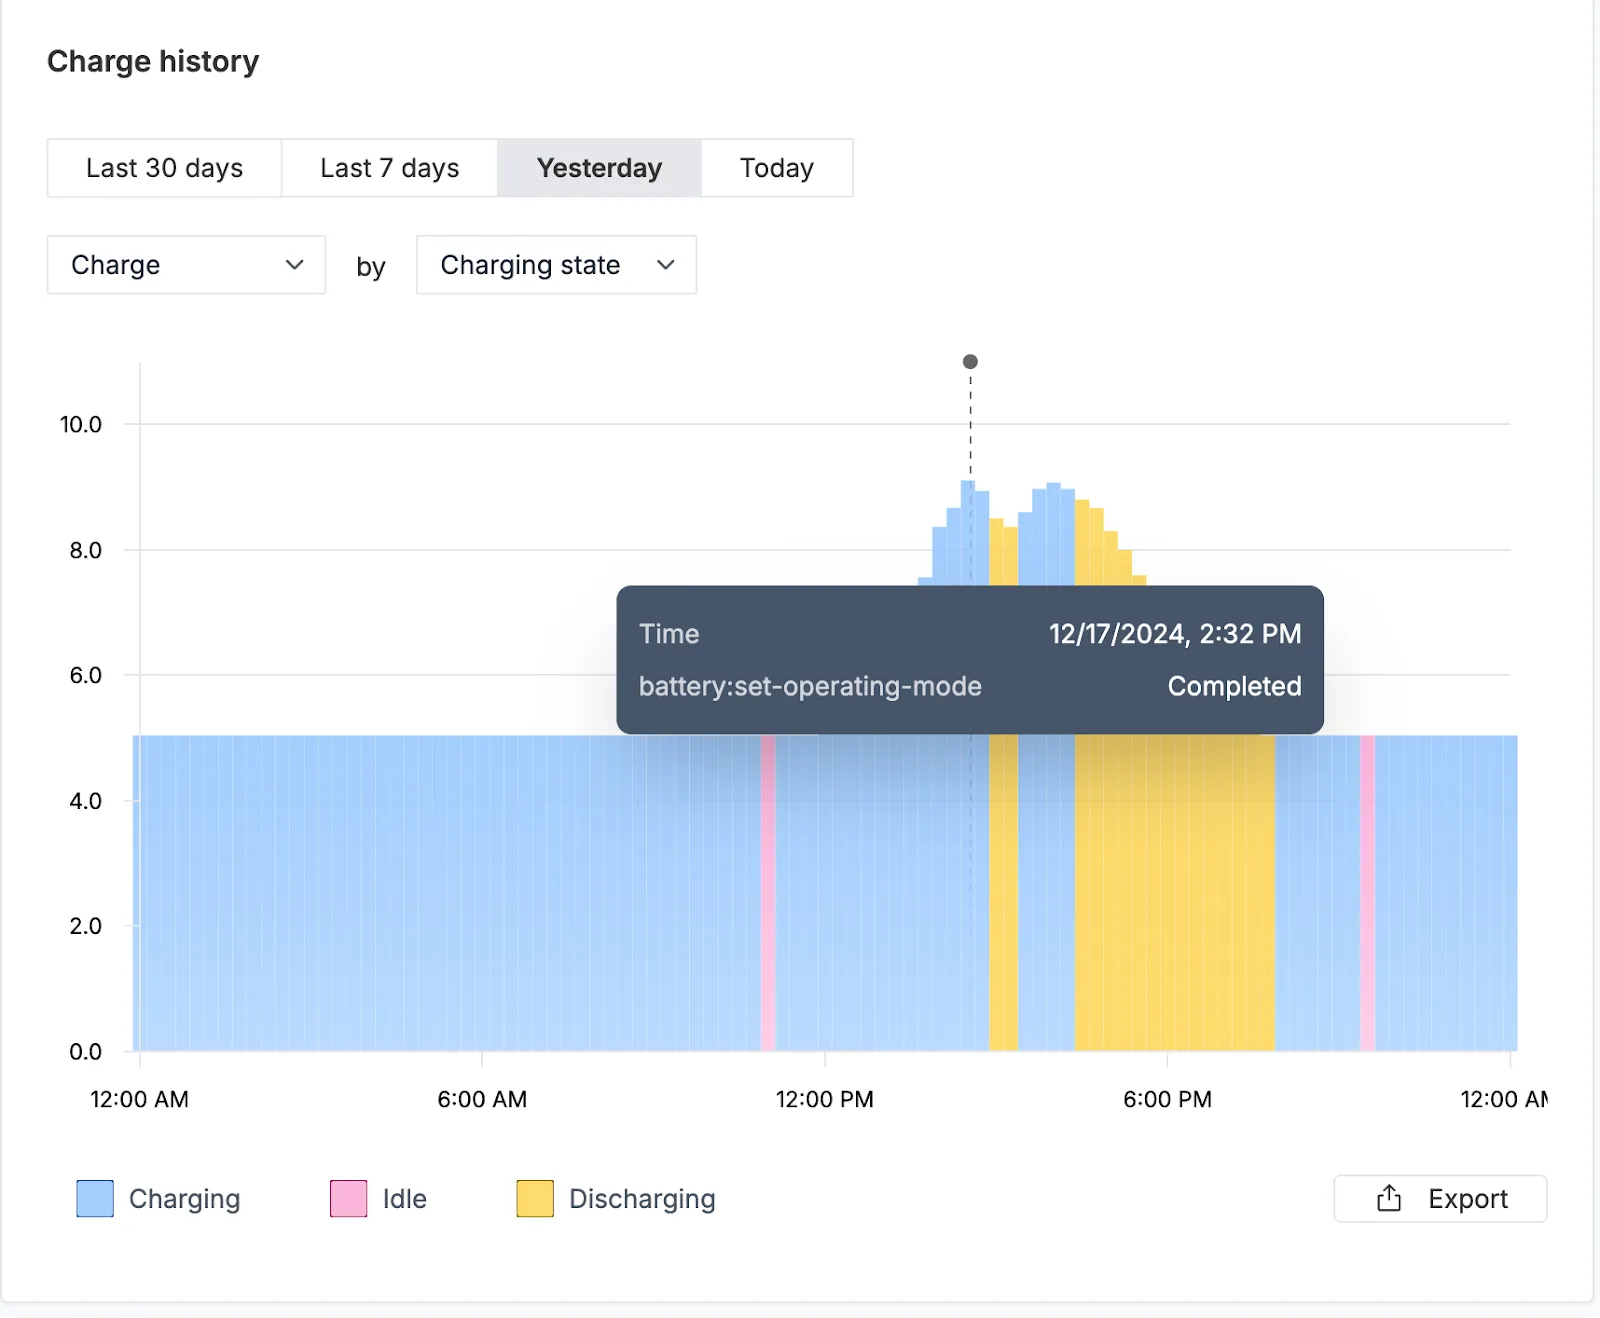
Device Detail 3 - Charge Percentage: Displays a real-time depiction of the battery’s state of charge to assess readiness for energy events or outages.
Charge Percentage 1 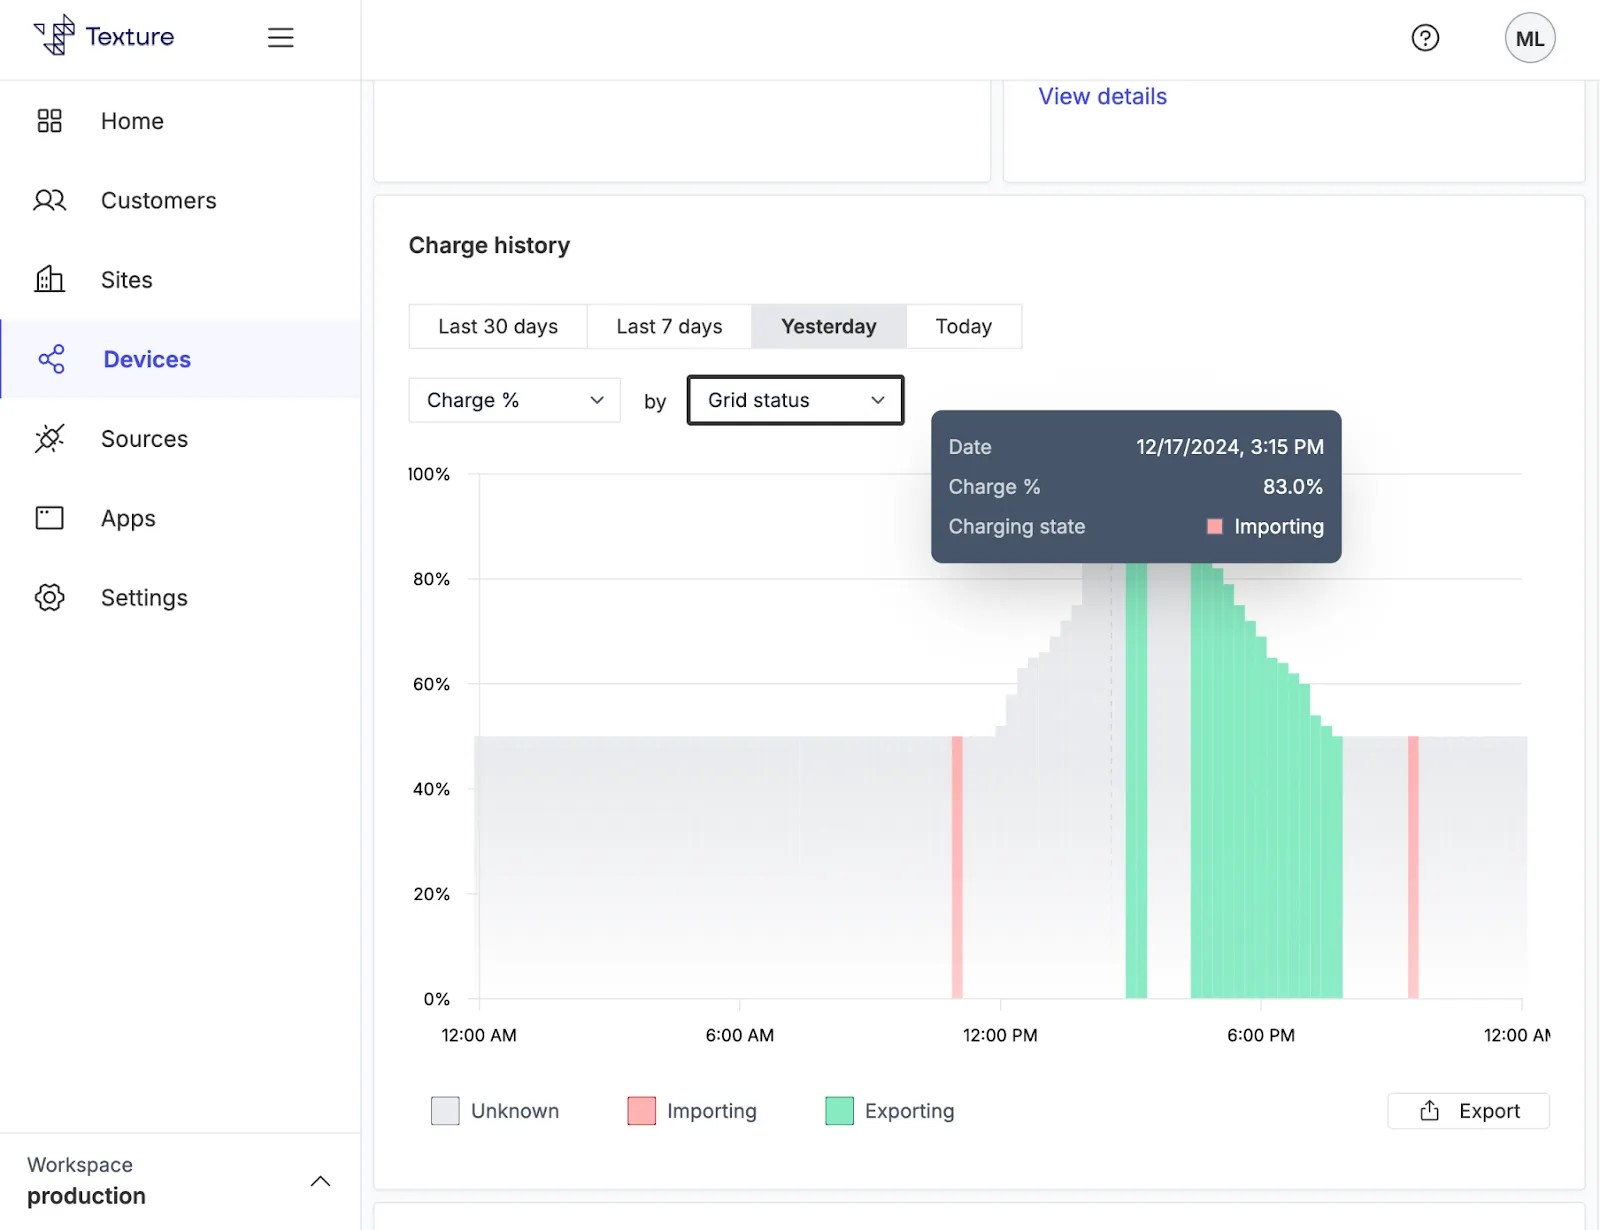
Charge Percentage 2
#Activity Feed
The Activity Feed provides real-time updates based on the 5–15 minute polling interval, allowing users to stay informed about key events. For those looking to dig deeper, the raw payload is accessible directly within this section for detailed exploration.
We’re actively enhancing this feature to make it more robust and valuable for our users. Here’s a preview of what’s coming:
- Event Types: The feed will soon include three distinct event categories:
- Connection Events: Device connected/disconnected.
- State Events: Changes such as Charging, Discharging, or Operating Mode adjustments.
- Command Events: Command sent/succeeded/failed.
- Change-Triggered Updates: Updates will be displayed only when something meaningful changes, such as a battery transitioning from Charging to Discharging.
- Filtering Options: Users will be able to filter the feed by Event Type and Time Range, making it easier to focus on the most relevant updates.
#Analytics Section
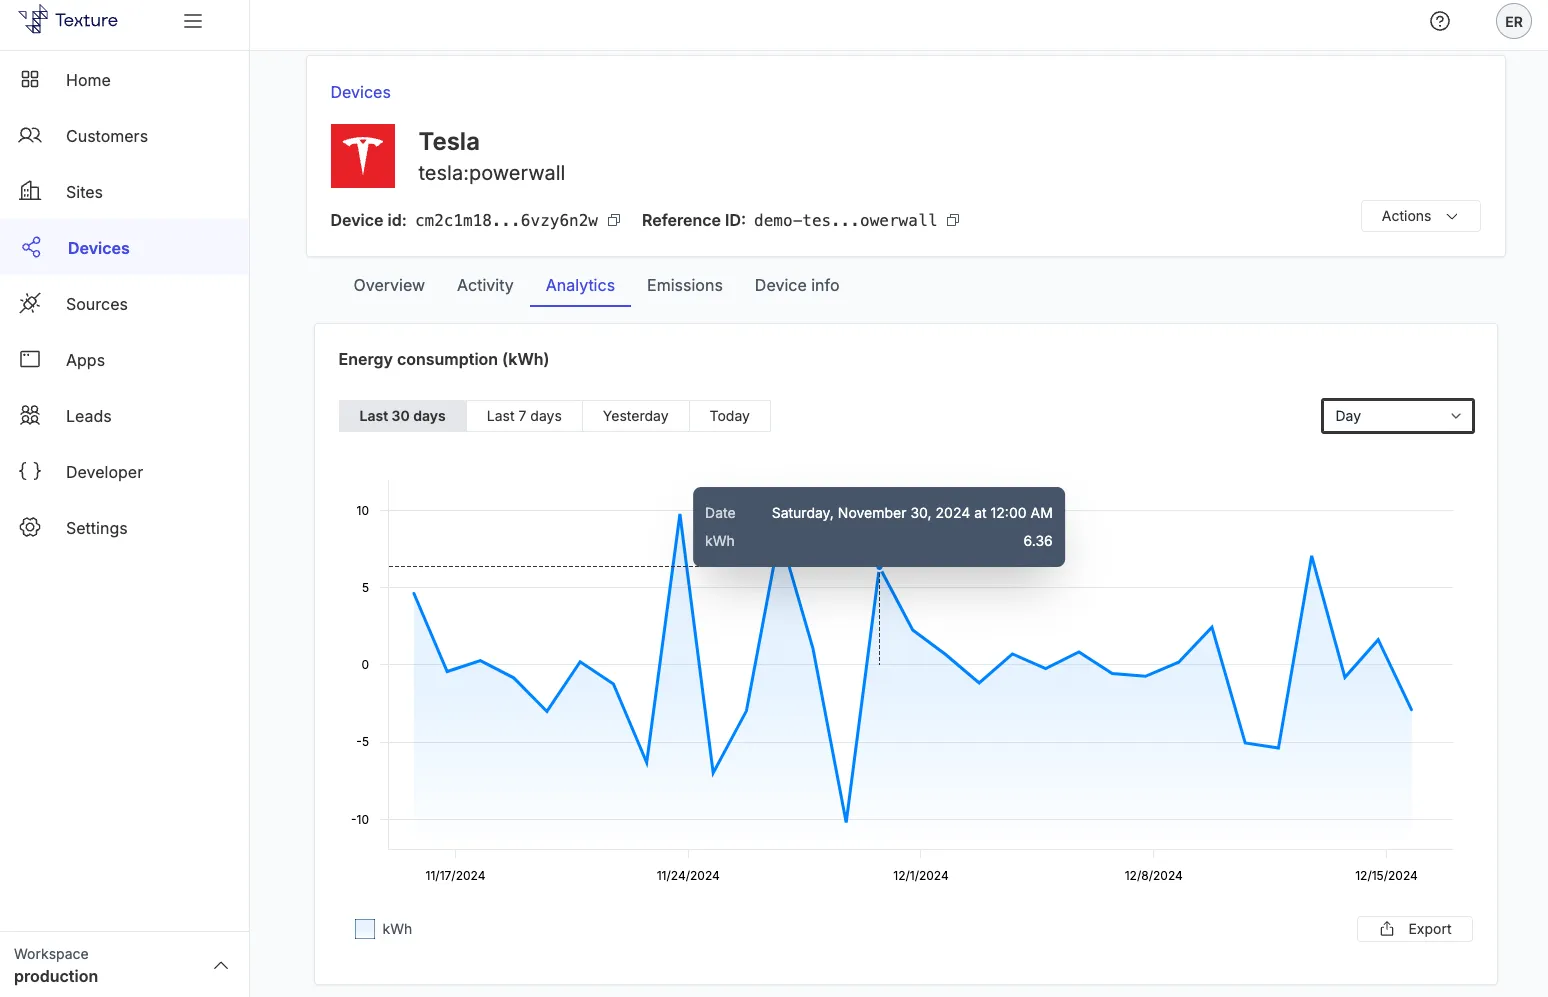
This graph includes time toggles (Last 30 days, Last 7 days, Yesterday, Today) and (Hour, Day, Week, Month), and hovering reveals data insights like date, time, and kWh.
Key graph:
- Energy Consumption (kWh): Tracks total energy usage by the battery.
- Positive Consumption: Indicates discharging (e.g., energy supplied back to the grid).
- Negative Consumption: Indicates energy drawn from the grid or another power source.
Battery analytics
#Emissions Section
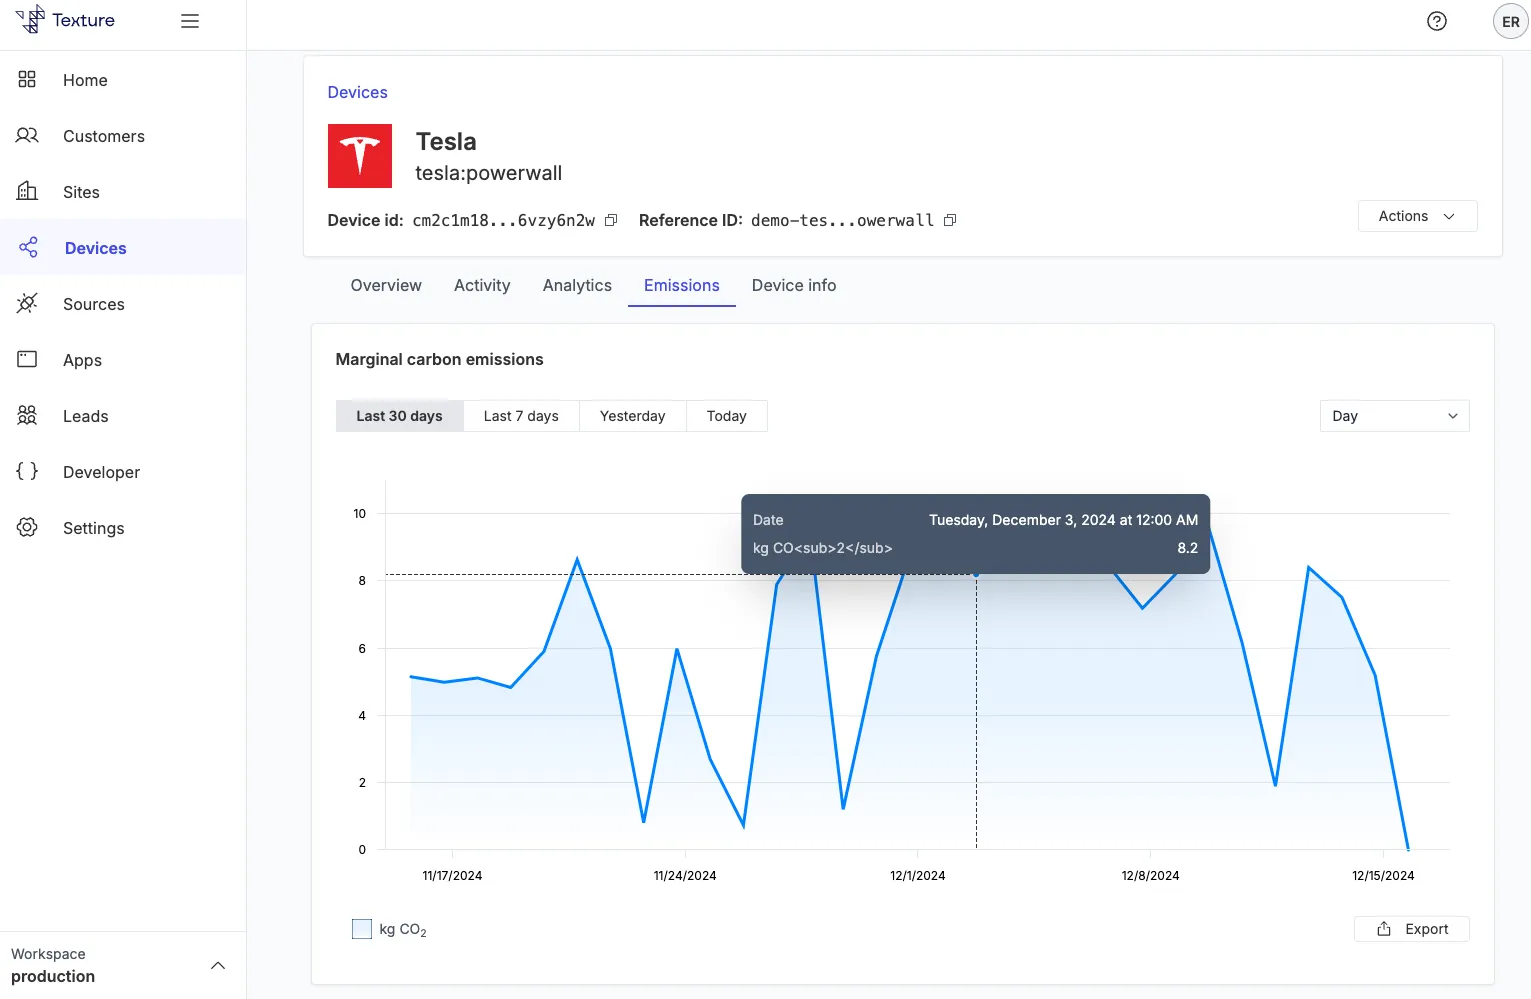
Texture has partnered with WattTime to provide marginal carbon emissions data for your energy network.
We fetch marginal carbon emissions data from WattTime for each location where you have energy data. We then combine this data with the energy data to get a complete picture of your energy network. We also store this data in our database for future analysis.
This graph includes time toggles (Last 30 days, Last 7 days, Yesterday, Today) and (Hour, Day, Week, Month), and hovering reveals data insights like date, time, and kgCO2e/kWh.
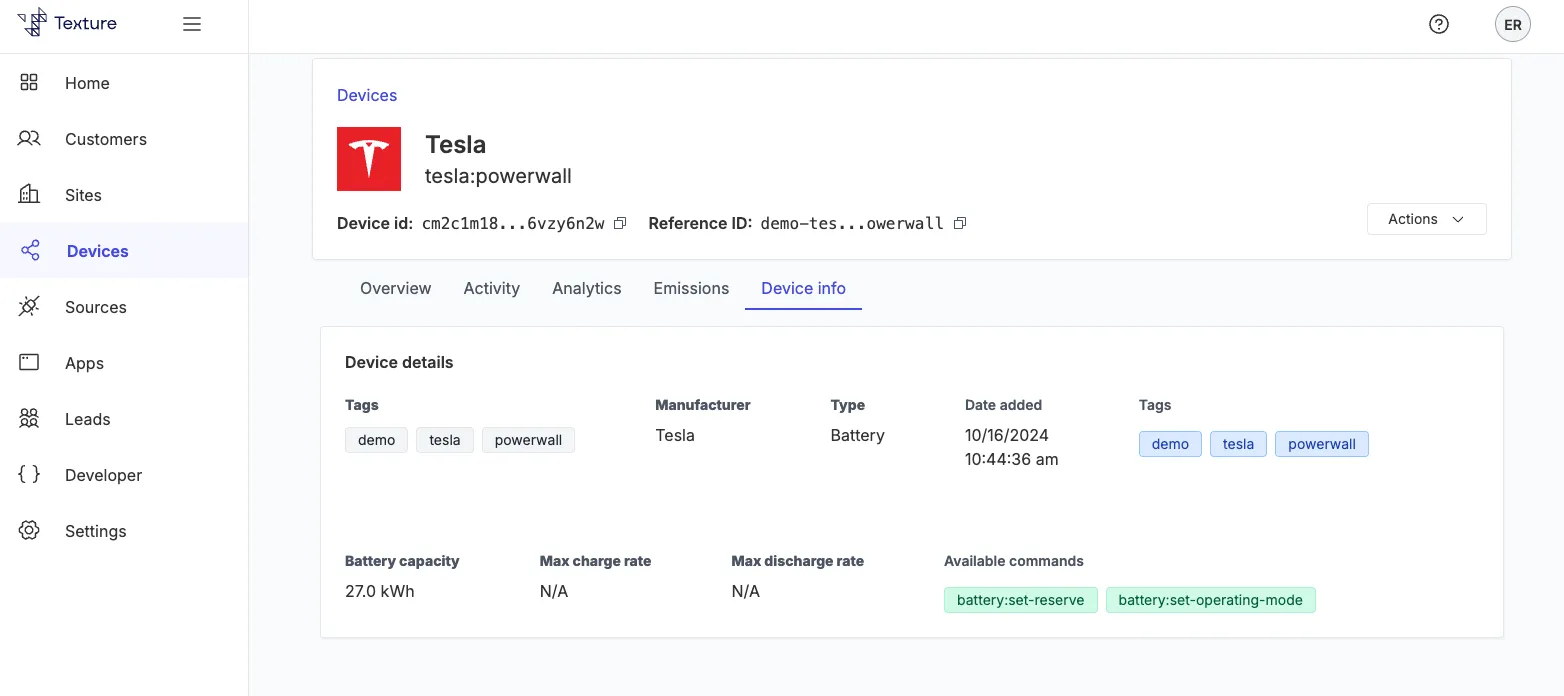
#Device Info Section
Here, users can access additional details such as:
- Manufacturer information.
- When the device was added to the system.
- Tags for organizing devices.
- Battery capacity, max charge rate, and max discharge rate.
- Available commands for device operation.
#Coming Soon: External Sharing
In Q1 2025, users will be able to securely share device data with others, such as device owners, through a third-party portal. We’ll also be building adapters to send data directly to your CRM, like Salesforce and Hubspot. Stay tuned for more details.
#Driving Value Through Insights
The enhanced Device Detail Page empowers customers to:
- Optimize Energy Storage and Usage: Analyze charge and discharge patterns to align energy storage strategies with peak demand periods or renewable energy availability.
- Validate Device Control Actions: Verify outcomes of battery commands in real time by seeing command history alongside changes in charge state, grid interaction, operating modes, and more.
- Enhance Reliability: Monitor metrics like backup reserve percentages and grid status to ensure readiness for outages or unexpected energy demands.
- Reduce Costs: Identify demand charge reduction and time-of-use optimization opportunities through analysis of grid interactions and charge rates.
- Support Sustainability Goals: Evaluate marginal carbon emissions (kgCO2e/kWh) to track and reduce environmental impact.
#Schedule a Demo
The Device Detail Page exemplifies Texture’s commitment to simplifying energy management while unlocking actionable insights. With real-time monitoring, intuitive visualizations, and robust data models, this feature empowers users to make informed decisions that drive efficiency, reliability, and sustainability.
Ready to see how Texture can enhance your energy network? Contact us today to learn more and schedule a demo!
